CROWD
IN THIS YEAR, THE RESULTS OF CROWD SOURCING ANALYSES ARE PART OF THE TOTAL SCORE FOR THE FIRST TIME. 63,000 AUSTRALIAN USERS HAVE CONTRIBUTED TO THE DATA GATHERING THAT TOOK PLACE FROM AUGUST TO OCTOBER, 2018.
While the drivetests and walktests determine the peak performance of the examined networks, crowdsourcing can add important dimensions such as time, geography or variety in devices and tariff plans – if done in the right way. For the collection of crowd data, P3 has integrated a background diagnosis processes into more than 800 diverse Android apps. If one of these applications is installed on the end-user’s phone and the user authorizes the background analysis, data collection takes place 24/7, 365 days a year. Reports are generated for every quarter of an hour and sent daily to P3‘s cloud servers. Such reports generate just a small number of bytes per message and do not include any personal user data. A more detailed description of our crowdsourcing methodology can be found in the methodology section. Based on the total population count of 24.6 million people, one of 390 inhabitants of the country has contributed to the gathering of 1.38 billion single samples of crowd data. The considered test area represents 81.8 per cent of the built-up area of Australia.
BEST COVERAGE RESULTS FOR VOICE AND DATA IN TELSTRA NETWORK. OPTUS OFFERS HIGHEST QUALITY OF 4G COVERAGE.
The Coverage and Quality of Coverage results determined in the crowdsourcing come hardly as a surprise: Telstra achieves the best results for the voice and data (3G + 4G) coverage, followed by Optus and – at a distinct distance – by Vodafone. However, Optus users have a slightly higher probability to being able to actually use 4G services (or a higher “Quality of Coverage”) than the customers of Telstra. Vodafone brings up the rear also in this examination.
ASSESSING COVERAGE
BASED ON CROWD KPIS
Our coverage metrics correspond to the results of our drivetests and walktests. However, it is no surprise that the crowdsourced KPIs for voice, data and 4G coverage deviate to a certain extent from the population coverage values stated by the operators: P3’s gathering of crowd data reflects where people actually are and move as opposed to their places of residence and working. Furthermore, our crowdsourcing also comprises indoor or other disadvantageous reception situations, while operators commonly base their claims on outdoor reception only.
TELSTRA SHOWS FASTEST DOWNLOAD SPEEDS IN TOP 10 PER CENT OF EVALUATION AREAS
In the assessment of download speeds available to the users, Telstra shows the best results for the top 10 per cent of Evaluation Areas. The values for the fastest users as well as the average user’s best throughput are practically on a par for all three contenders. Generally, it must be taken into consideration that a part of the actual user base probably experiences data speed limitations caused by their mobile tariffs.
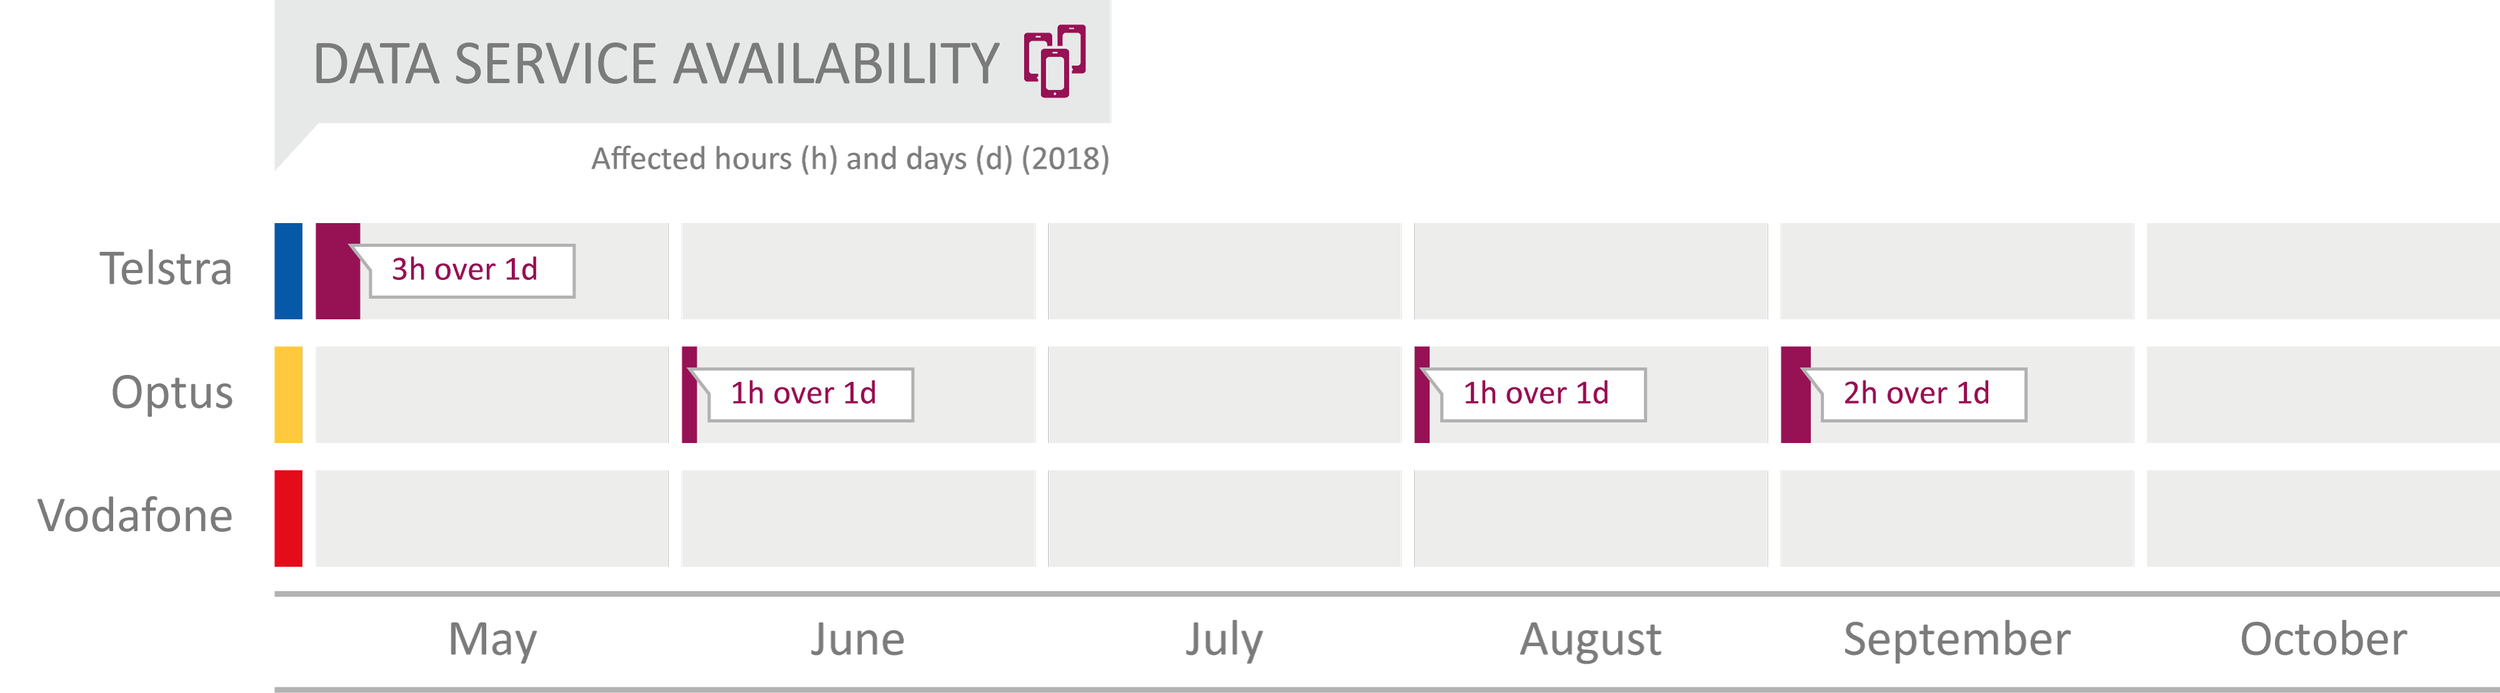
VODAFONE DID NOT SHOW SERVICE DEGRADATIONS FROM JULY 2018 TO OCTOBER 2018
Examining the Data Service Availability, shows pleasant results. Other than the rest of the crowd KPIs, this examination covers six months (May to October 2018). As a deeper investigation revealed,none of the operators suffered service degradations from July 2017 to April 2018. So the Vodafone network showed no impairment in an impressive period between July 2017 and October 2018. For Telstra and Optus we have identified only minor degradations (see chart below).
“TELSTRA IS THE WINNER IN THE CROWD ASSESSEMENT DUE TO BEST VOICE AND DATA COVERAGE AND FAST DATA RATES.”


“CROWD RESULTS AT A GLANCE
Telstra achieves the best results for the voice and data coverage, but Optus shows a higher Quality of 4G Coverage. Telstra shows the highest speeds for the top 10 per cent of Evaluation Areas. The fastest users as well as the average user’s best throughput are on a par. Vodafone can pride itself to have had no service degradations in more than 12 months.”

More than 14 million (or 60 per cent of all) Australians live in one of the five largest urban areas of the country – plus another 368,000 in its capital Canberra. Therefor we have taken a closer look at the individual results of Adelaide, Brisbane, Canberra, Melbourne, Perth and Sydney.
TELSTRA IS THE LOCAL CHAMPION IN SYDNEY, OPTUS AND VODAFONE ALSO STRONG.
In Sydney, Telstra takes the lead and Optus follows at a close distance. As in the nationwide results, Vodafone ranks third. But as it is typical for the larger Australian cities, its gap to its two stronger competitors is much closer than in the overall benchmark results.
IN MELBOURNE AND CANBERRA, OPTUS TAKES THE LEAD AHEAD OF TELSTRA. VODAFONE FOLLOWS AT A WIDER GAP.
In Melbourne and Canberra, Optus takes a narrow lead ahead of Telstra, which derives mostly from strong data results. In the voice assessment, both operators are on a par. Vodafone falls behind a little more distinctly than in most of the other bigger cities. In the crowdsourcing analyses, all three contenders are close together – which can also be seen in many other cities.
IN BRISBANE, VODAFONE OVERTAKES OPTUS – BUT TELSTRA STILL LEADS.
In Brisbane, Vodafone is particularly strong, seizing the second rank behind the still leading Telstra and ahead of Optus. This lead is especially earned by a very robust performance in the data category.
TELSTRA WINS IN PERTH AND ADELAIDE.
In Perth, Optus and Vodafone are almost on a par, but still outdone by a very strong Telstra. In Adelaide, all three networks are almost equally strong, although Telstra still wins. As in Brisbane before, Vodafone overtakes Optus by a narrow margin.


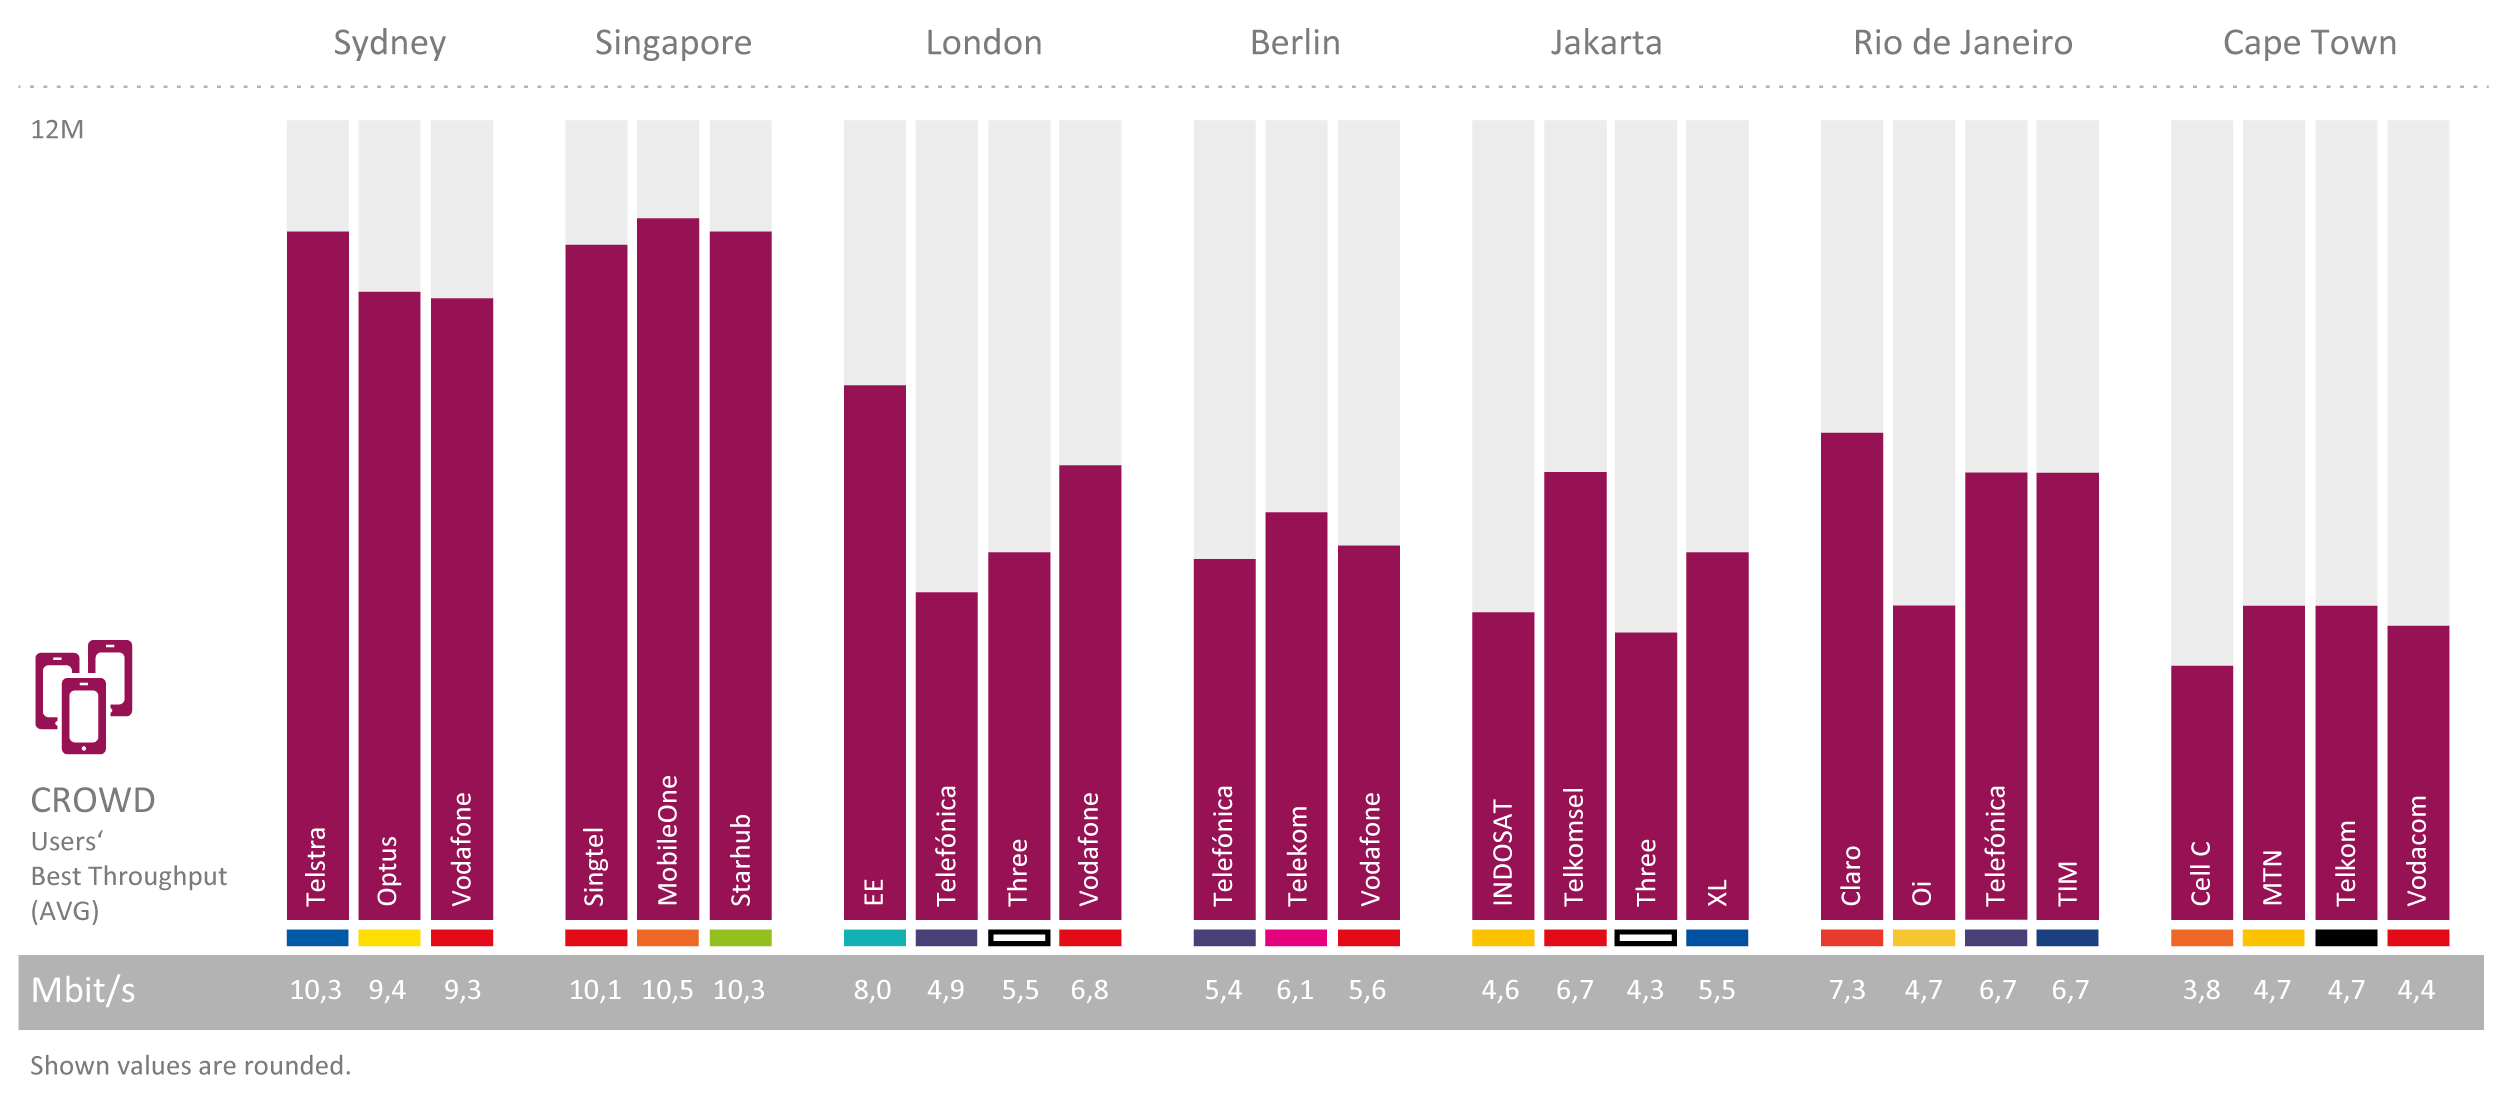
A look at the average values of the best throughputs achieved by each individual user participating in our crowdsourcing (see chart below) shows that the Australian operators deliver considerably high performance also when compared to their global competitors.
SYDNEY AND SINGAPORE AHEAD OF OTHER WORLD BUSINESS CAPITALS
As can be clearly seen, only Singapore ranks on the same high level as Sydney which we have selected for this comparison. However, when evaluating the actual values, it must be taken into account that areas such as Singapore are densely covered with buildings, whereas cities like Berlin or London contain a higher share of open spaces such as parks or fringe areas, which are provided with less mobile coverage and also comprise of less mobile users. In order to ensure statistical relevance, we had to exclude Jakarta‘s smallest operator Smartfren from the line-up. The analysis at hand concentrates on data throughputs. But an additional look at the Areas and Quality of Coverage with 4G services, 3G/2G data services as well as voice services in the considered cities also shows favourable results for Singapore and Sydney – however, some competitors such as London or Jakarta come close in one or the other of the analysed metrics. Deeper insights can be made available to interested parties on request.