
TESTING METHODOLOGY
The methodology of the P3 connect Mobile Benchmark is the result of P3’s many years of experience. It was carefully designed to evaluate and objectively compare the performance and service quality of Sweden’s mobile networks from the users’ perspective.
The P3 connect Mobile Benchmark in Sweden took place from October 25th to November 16th, 2016. All samples were collected between 8am and 10pm. The network tests covered larger cities, smaller towns and connecting roads. The combination of test areas had been carefully selected to provide a significant series of test results cove ring the Swedish population. The areas chosen for the 2016 test account for more than 3.3 million people, or 41.4 per cent of the total Swedish population.
P3 conducted the tests with two drive-test cars, equipped with arrays of Samsung Galaxy S5 Cat 4 smartphones (Voice) and Samsung Galaxy S7 Cat 9 smartphones (Data) for the simultaneous measurement of voice and data services.
Voice testing
Two smartphones per operator in each car were used for the voice tests, setting up test calls from one car to another. The audio quality of the transmitted speech samples was evaluated using the HD-voice capable and ITU standardized so-called POLQA wideband algorithm. All Swedish network operators offer 4G capable subscriptions. To take the high share of LTE offerings into account, speech samples were acquired partly in 4G preferred to 3G preferred mode and partly in 4G preferred to 4G preferred mode. As a consequence, the phones in most cases needed to switch (“fall back”) to 2G or 3G when they were logged into LTE (so called “circuit-switched fall back“ or CSFB).
In order to account for typical smartphone use scenarios during the voice tests, background data traffic was generated in a controlled way through random injection of small amounts of HTTP traffic. The voice test scores account for 40 percent of the total benchmark results.
Data testing
Data performance was measured using two smartphones in each car – one per operator. The radio access technology was set to LTE preferred mode in order to reflect the customer experience. The web tests accessed web pages according to the widely recognized Alexa ranking. In addition, the artificial (static) “Kepler” test web page as specified by ETSI (European Telecommunications Standards Institute) testing purposes was used.
In order to test the data service performance, files of 3MB and 1MB for download and upload respectively were transferred from or to a test server located on the Internet. In addition, the peak data performance was tested in uplink and downlink directions by assessing the amount of data that was transferred within a 10 seconds time period. Another discipline was the playback of Youtube videos. It took into account that Youtube dynamically adapts the video resolution to the available band - width. So, in addition to the success ratios, start times and playouts without interruptions, the Youtube measurements also determined the average video resolution.
All the tests were conducted with the best-performing mobile plan available from each operator. Data scores account for 60 per cent of the total results.

Three boxes were mounted into the back and into the side windows of each measuring car in order to support twelve smartphones per car.
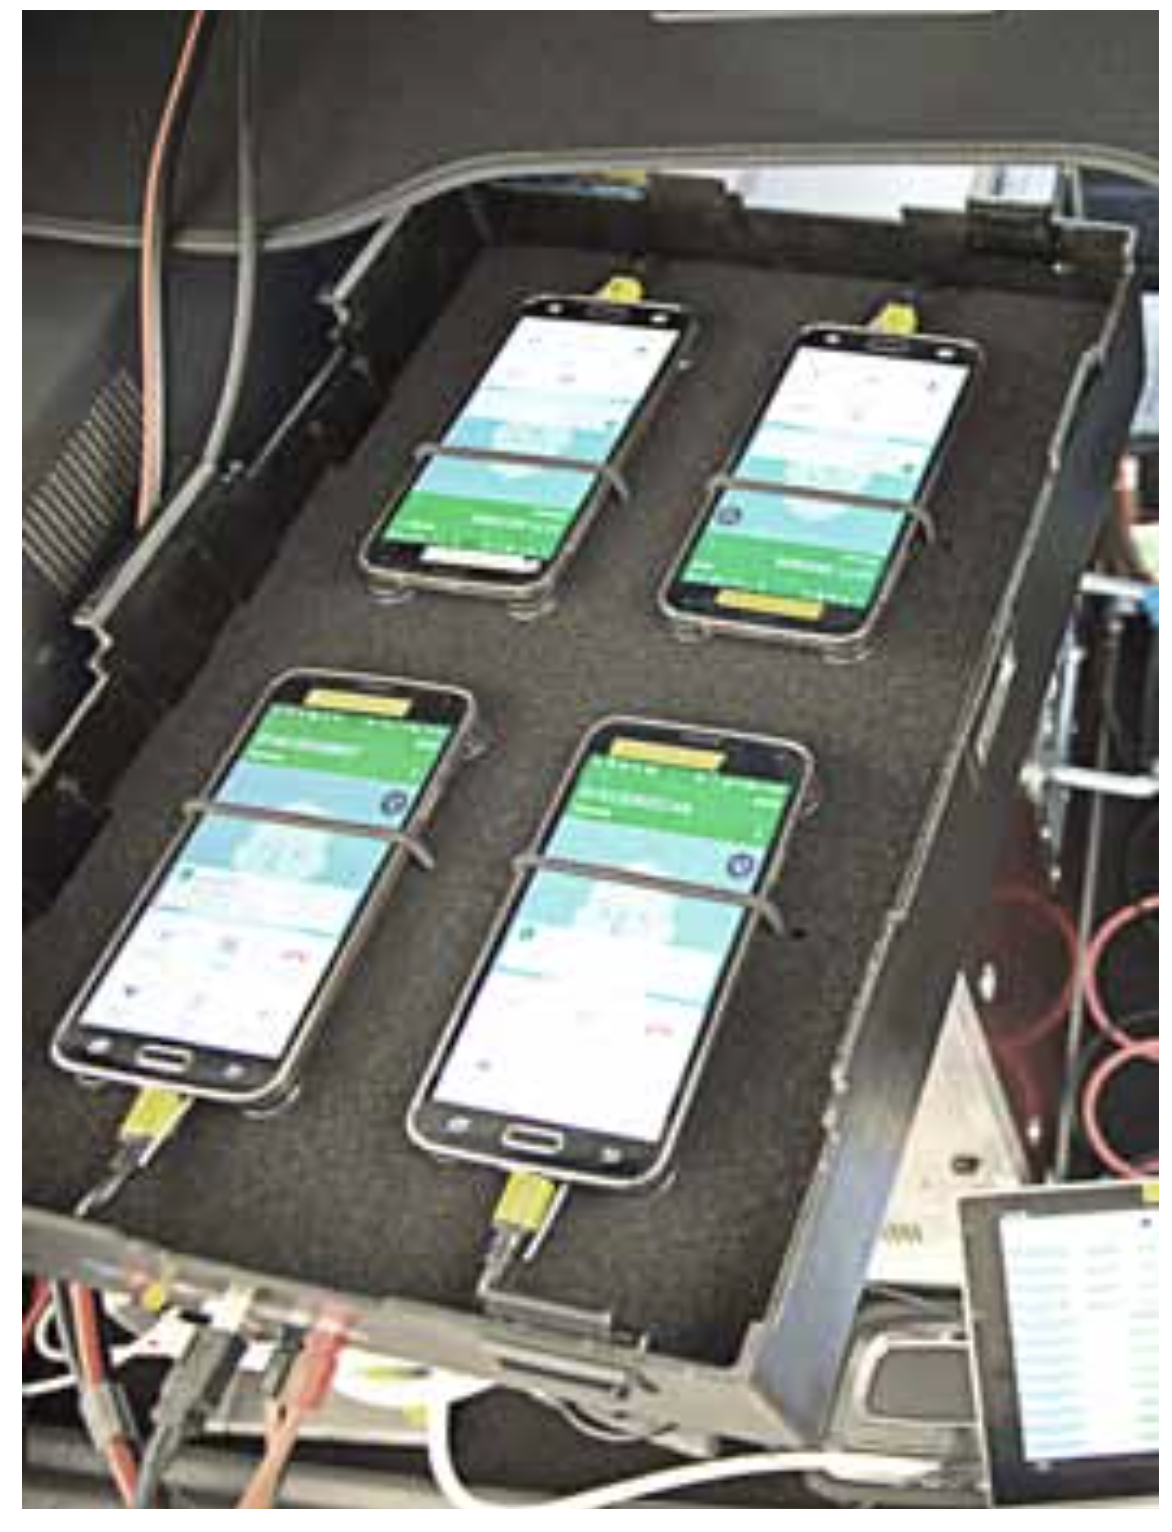
Each box housed four smartphones allowing the simultaneous testing of four mobile operators.
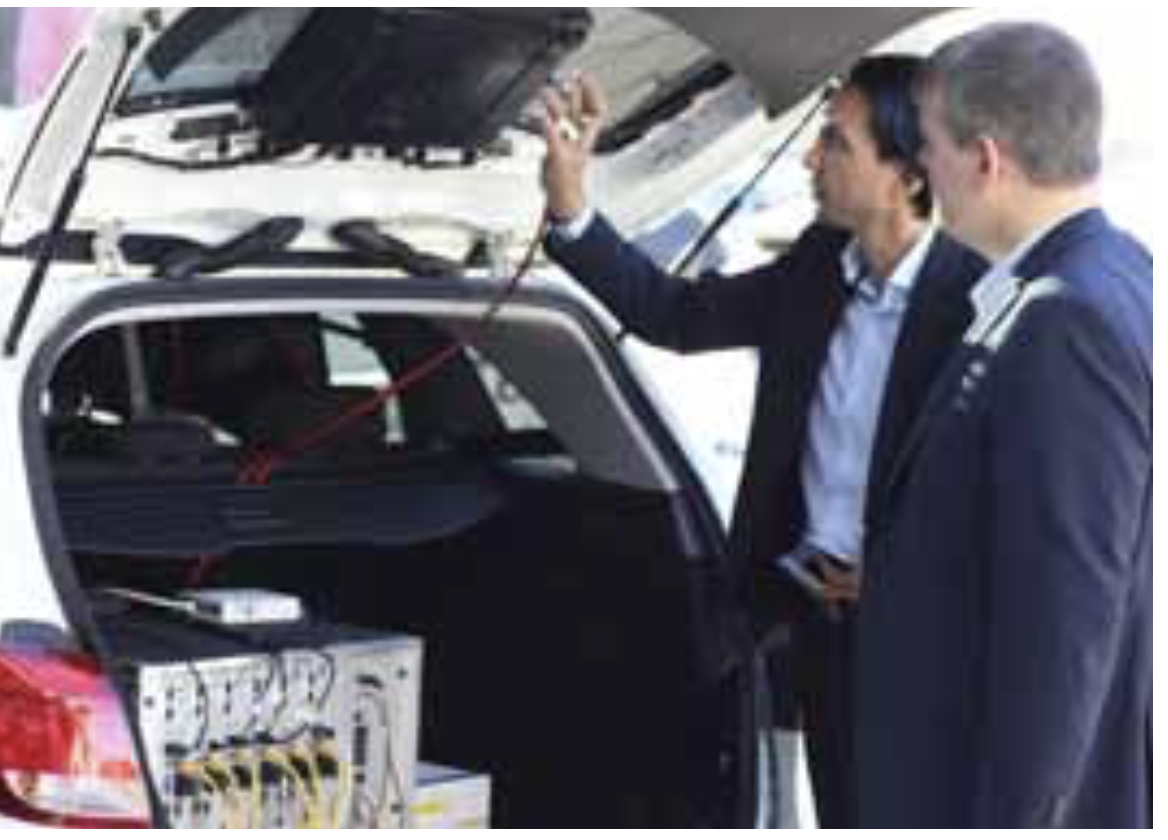
Hakan Ekmen, CEO, P3 communications GmbH and Bernd Theiss, Head of connect’s test lab, inspect the testing equipment.

Routes and samples
The test routes are shown on page 1 of this report. In the 12 big cities and 18 smaller towns indicated, the cars had to follow predefined routes. All together, the four test cars covered more than 7820 kilometres, of which approximately 3780 km led through the big cities, while 4040 km were covered in smaller towns and on connecting roads.
Performance indicators and rating
The score weighting reflects both the geographical distribution of Sweden‘s popu lation and the ranking of usage scenarios. Therefore, 600 of the total of 1000 maximum points were assigned to the cities – 240 maximum points refer to the voice results and 360 maximum points reflect the data results. For the towns and the roads, a maximum of 200 points each is available. In both categories, the possible maximum is 80 points in the voice, and 120 points in the data cate gory. The tables on page 2 and page 10 of this report show the percentage of maximum points that each operator has achieved in each discipline.

Conclusion
The overall level of performance is high - our test results leave Swedish customers with a
choice between four strong networks.
After closely examining the single categories of our benchmark, the overall result does probably not come as a surprise: Telia is the overall winner, with a very strong Telenor ranking second. Tele2, who is Sweden‘s number two in subscriber numbers, comes in third. And Tre, the smallest Swedish operator, ranks last. However, both Tele2 and Tre achieve the well deserved grade „good“. Especially in the smaller Swedish towns that we visited during our test drives, the distance between all four candidates is so close that neither operator is a bad choice. In larger cities, customers can expect a little more performance from Telia, and on roads Telenor provides somewhat more stable connections. However, these differences are small, as all four Swedish providers operate on a very high level. When comparing the results of P3‘s first mobile network benchmark in Sweden to those from recent tests in other European countries, Swedish operators are among the top tiers. Especially, Telia and Telenor perform on a similar high level as the top candidates for example in Germany or Spain. Only the best networks in traditionally strong countries such as Switzerland, Austria or the Netherlands still outrank Sweden‘s top contenders. And even the fourth-ranking Tre scores at a level that would make it a candidate for a winning position for example in the UK. So, all in all, Swedish customers can be really happy with the quality and performance of their mobile networks.
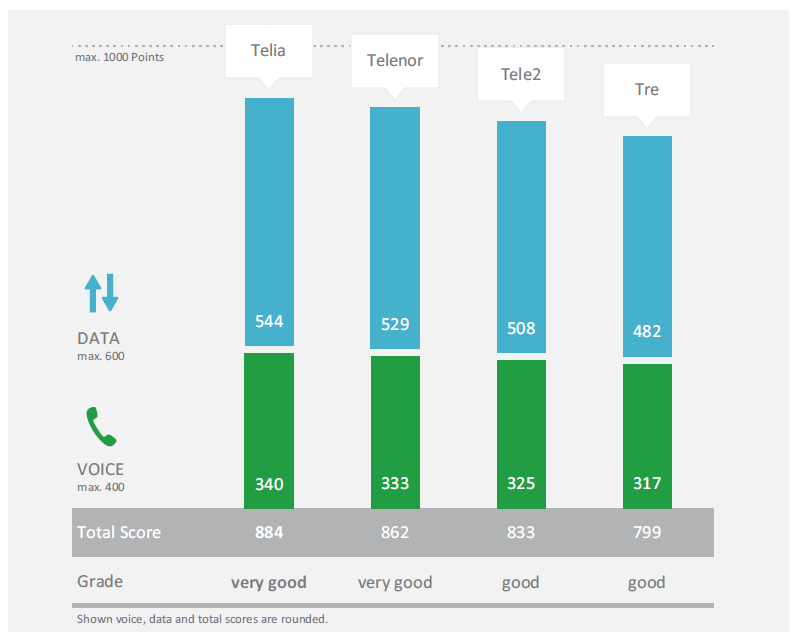


The Swedish market leader wins this benchmark with a lead in the voice and data categories and the overall grade “very good“. While Telia has to give way to its competitors regarding some stability aspects like setup times and success ratios, it scores noticeably better in the performance categories such as data rates.


Telenor achieves a strong second rank and is also awarded the overall grade “very good“. Though this operator scored slightly higher in some aspects like setup times and success ratios. It also turned out to be the strongest contender on the roads both in voice and data. All in all, Telenor is a serious competitor to winner Telia.

Sweden’s number two in terms of subscriber counts achieves a well-deserved third rank in this benchmark. Scoring a bit behind Telia and Telenor in almost all our test categories, Tele2 is awarded the overall grade „good“. Particularly in smaller towns, this operator turned out to be almost equally strong as its competitors.

Sweden’s smallest operator scores last in this benchmark. However, Tre’s results are still very competitive and deserve the overall grade „good“. If this provider manages to improve its performance especially in the cities, it might score considerably better in next year’s P3 connect mobile benchmark Sweden.
Outlook
Objective testing will be essential to the ongoing evolution of the Swedish networks as to emerging technologies like autonomous driving and smart cities. P3 communications is preparing for these future challenges.
All four candidates scored really well in our first mobile network test in Sweden. This, however cannot be taken for granted. Upcoming improvements like the further extension of 4G coverage, the ongoing network evolution with technologies like “4G Advanced“ and the introduction of Voice over LTE (VoLTE) may easily change this picture.
P3 communications is well prepared to accompany this development of the Swedish telecommunications market. In this context, we are al ready preparing to include new technologies and enhancements mentioned above in next year‘s testing. Furthermore, P3 is also preparing for future challenges starting with new communications applications like autonomous driving and smart cities (see below), ranging all the way up to completely new mobile communications technologies like the upcoming super-fast 5G networks. However, 5G‘s approach of assigning different network capabilities to different use cases, will also require an extended approach to network testing.This will involve concepts like advanced analytics and big-data technology.
Extensions to the test routines
Readers interested in taking part in our continuous efforts to evaluate the performance of mobile networks can already do so today – by downloading the “U get“ wire less performance rating app. See details on the right. This crowdsourcing approach will give us valuable additional insights into the user experience and operational performance of the Swedish mobile networks in the near future.

P3 communications is constantly monitoring technological development – for example by regularly participating in industry events.

crowdsourced network rating
P3 communications is increasingly focussing on aspects like the retainability of voice services, the integrity of data services and “operational excellence“. An important instrument for this approach is the “U get“ app that is available under uget-app.com or via the adjoining QR code. This app checks and visualises current network performance. Join the global community of users who understand their personal wireless performance, while contributing to the world’s most comprehensive picture of the mobile customer experience.
Autonomous Driving

The future of transport is quickly coming upon us – one kilometre loop at a time. With each new generation of car models, the automotive industry comes closer to its vision of highly automated driving cars. However, to ensure that driverless cars can maintain connectivity and thus optimal performance and safety, we need to ensure that the technological infrastructure can manage the in creasing demand that machines will place upon it. There fore, autonomous driving scenarios play an important role in P3 communications‘ concepts for the evolution of mobile network testing.
Smart Cities

Today, 54% of the world’s population lives in urban areas, a pro- portion that is expected to increase to 66% by 2050. Mobile com- munications will be an essential component to delivering on smart city promises. To enable smart cities to thrive and host successful businesses in the digital era, their technological infrastructure must be capable of managing the increased demand on network usage. Therefore it will be a future focal point of P3 communica- tions to determine whether cities become truly smart by taking an even closer look at their advances in connectivity.