
TESTING METHODOLOGY
The methodology of the P3 connect Mobile Benchmark is the result of P3’s many years of experience. It was carefully designed to evaluate and objectively compare the performance and service quality of Sweden’s mobile networks from the users’ perspective.
The P3 connect Mobile Benchmark in Sweden took place from August 19th to September 9th, 2017. All samples were collected between 8am and 10pm. The network tests covered 21 larger cities, of which 7 count more than 100 000 inhabitants. Additionally, our test routes led through 33 smaller towns as well as the connecting roads. This combination of test areas had been carefully selected to provide a significant series of test results covering the Swedish population. The areas chosen for the 2017 test account for more than 4 million people, or 42 per cent of the total Swedish population.
P3 conducted the tests with two drive-test cars, equipped with arrays of Samsung Galaxy S7 Cat 9 smartphones (Voice) as well as a mixed allocation of Samsung Galaxy S7 and Sony Xperia XZ Cat 9 smartphones (Data) for the simultaneous measurement of voice and data services.
Voice testing
Two smartphones per operator in each car were used for the voice tests, setting up test calls from one car to another. The audio quality of the transmitted speech samples was evaluated using the HD-voice capable and ITU standardized so-called POLQA wideband algorithm. All Swedish operators offer 4G capable subscriptions. To take the high share of LTE offerings into account, speech samples were acquired partly in 4G preferred to 3G preferred mode and partly in 4G preferred to 4G preferred mode. As a consequence, in 4G networks with VoLTE support, the phones would prefer this voice mode. In 4G networks without VoLTE, they would need to to switch (“fall back”) to 2G or 3G for the voice calls (so called “circuit-switched fall back” or CSFB). In order to account for typical smartphone use scenarios during the voice tests, background data traffic was generated in a controlled way through random injection of small amounts of HTTP traffic. The voice test scores account for 40 per cent of the total benchmark results.
Data testing
Data performance was measured using four smartphones in each car – one per operator. One car was equipped with four Samsung Galaxy S7 while the other car was carrying four Sony Xperia XZ in order to respect the variable data performance of different smart phones in different networks. In order to further reflect the customer experience, the radio access technology was set to LTE preferred mode. The web tests accessed web pages according to the widely recognized Alexa ranking. In addition, the static “Kepler” test web page as specified by ETSI (European Telecommunications Standards Institute) was used.
In order to test the data service performance, files of 3MB and 1MB for download and upload respectively were transferred from or to a test server located on the Internet. In addition, the peak data performance was tested in uplink and downlink directions by assessing the amount of data that was transferred within a 7 seconds time period. Another discipline was the playback of Youtube videos. It took into account that Youtube dynamically adapts the video resolution to the available bandwidth. So, in addition to success ratios, start times and playouts without interruptions, Youtube measurements also determined the average video resolution.
All the tests were conducted with the best-performing mobile plan available from each operator. Data scores account for 60 per cent of the total results.

Three boxes were mounted into the back and into the side windows of each measuring car in order to support twelve smartphones per car.
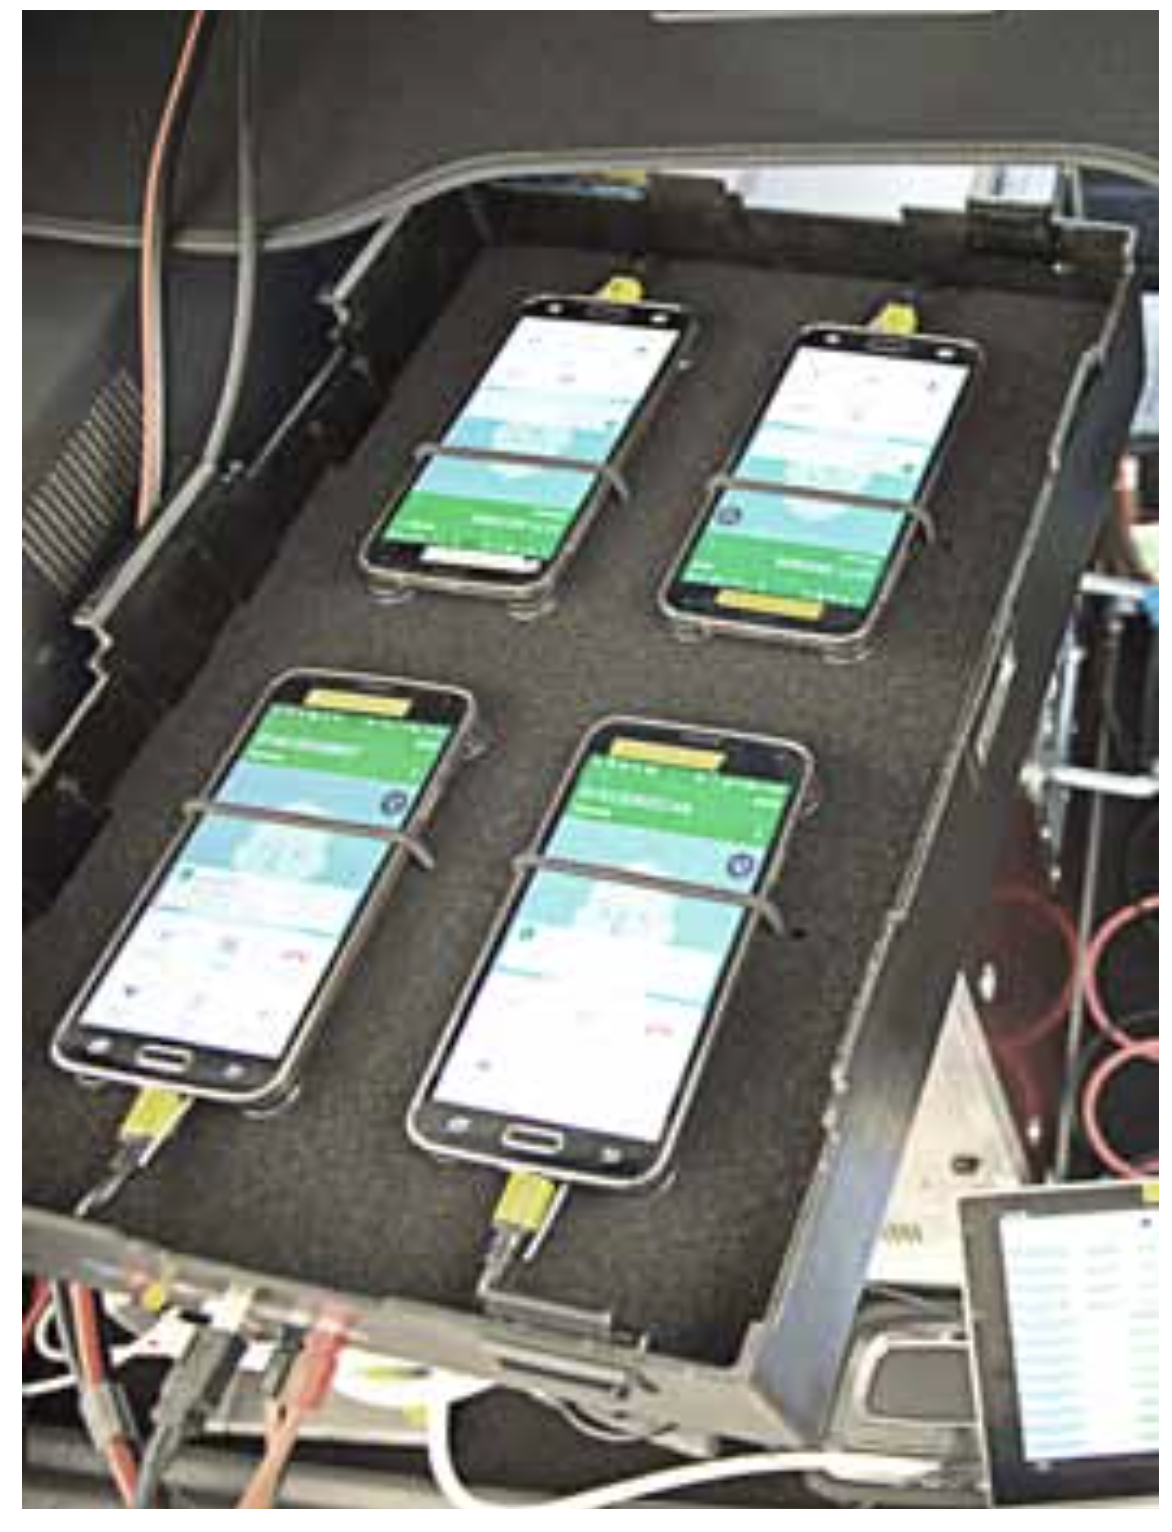
Each box housed four smartphones allowing the simultaneous testing of four mobile operators.
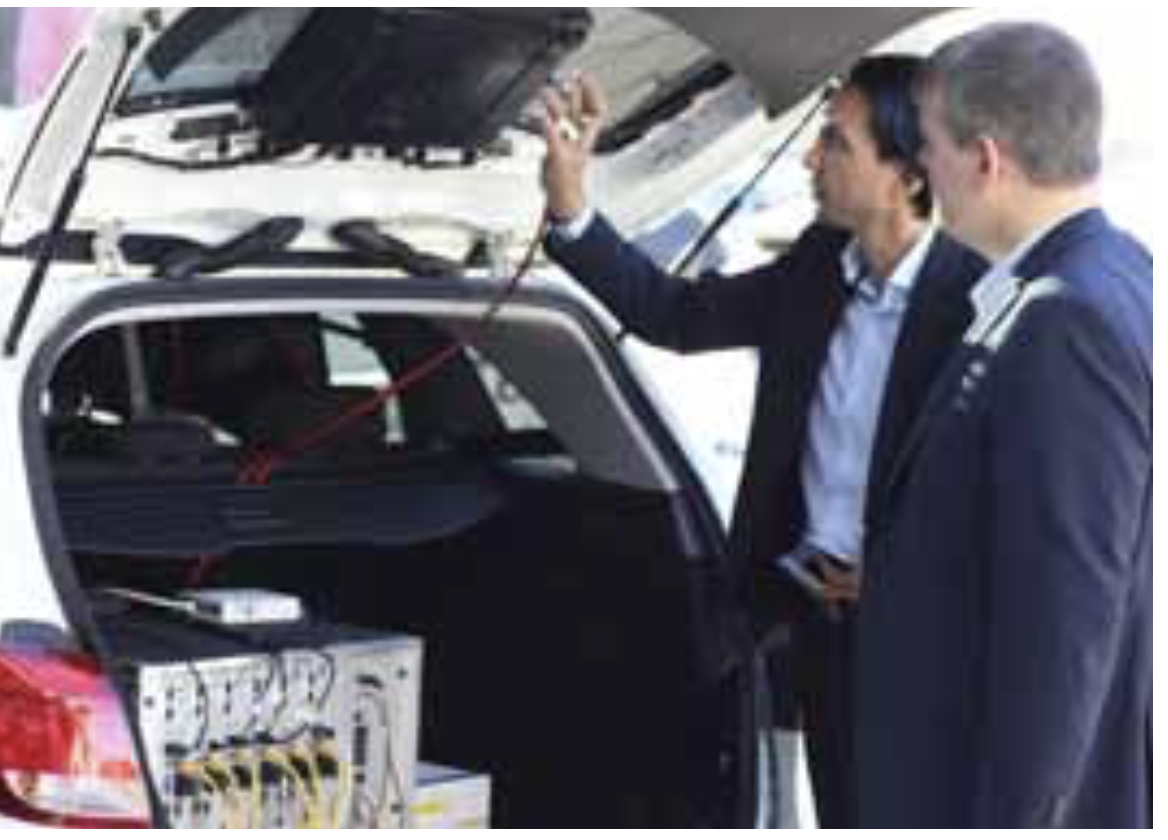
Hakan Ekmen, CEO, P3 communications GmbH and Bernd Theiss, Head of connect’s test lab, inspect the testing equipment.

Routes and samples
The test routes are shown on page 1 of this report. In the 21 big cities and 33 smaller towns indicated, the cars had to follow predefined routes. Altogether, the two test cars covered more than 10 000 kilometres, of which approximately 3700 km led through the big cities, while 6300 km were covered in smaller towns and on connecting roads.
Performance indicators and rating
The score weighting reflects both the geographical distribution of Sweden‘s population and the ranking of usage scenarios. Therefore, 600 of the total of 1000 maximum points were assigned to the cities – 240 maximum points refer to the voice results and 360 maximum points reflect the data results. For the towns and the roads, a maximum of 200 points each is available. In both categories, the possible maximum is 80 points in the voice, and 120 points in the data category. The tables on page 2 and page 10 of this report show the percentage of maximum points that each operator has achieved in each discipline.

Conclusion
Despite overall strong performance levels, our benchmark of the four Swedish mobile networks still shows a distinct ranking order.
The overall result is quite clear: Telia successfully defends the first rank in Sweden and was even able to improve both in the voice and the data categories over the results of our previous benchmark. In the voice category, Telia shares the top position with Tele2, which is an indicator of the huge efforts that this operator took in order to improve on its position in the overall ranking. These steps include the successful deployment of both VoLTE and carrier aggregation. The still considerable point gap between the two highest ranks, however, can be explained with Tele2 ranking only third in the data category.
Telenor is the only contender in this benchmark not being able to improve on its results of the previous test. A closer examination shows that its performance is almost identical to the results of our 2016 benchmark in Sweden. But as we have raised some thresholds in our scoring scheme and the competitors can already benefit from improved technologies like VoLTE, just staying at the same level actually means a loss of points. In the voice category, the smallest Swedish operator Tre is even threatening to surpass Telenor, who is only one point ahead in this category.
Swedish networks among the best in Europe
While still holding the fourth rank, Tre could improve its performance over its 2016 results. This is especially true in the data category. Also, one should bear in mind that with 813 points and the overall grade “good”, even this smallest Swedish operator would achieve a top position in other markets with a weaker mobile environment.


The Swedish market leader wins this benchmark with a clear lead in the data category and the overall grade “very good”. In the voice discipline, test winner Telia shares the first rank with Tele2. Compared to the results of our 2016 mobile benchmark in Sweden, Telia improves both in the voice and data categories.


Obvious efforts to improve its technology and performance result in a very good second rank for Tele2. Thanks to the introduction of VoLTE, this operator even shares the first position with the overall winner Telia in the voice discipline. Also, Tele2 achieves the biggest score improvement in comparison to our previous year’s test.

Having ranked second in our 2016 benchmark, this year, Telenor falls to a third rank but still receives the grade “very good”. Its overall results are on the same level as in the previous year. But rising thresholds as well as powerful competitors prevented a better placement this time. Accept the challenge, Telenor, and pursue a higher rank next year!

As in our previous benchmark, Sweden’s smallest operator Tre scores last in this benchmark. However, Tre could clearly improve over its results from our 2016 mobile network test and absolutely deserves the grade „good”. After vast improvements in data, maybe a similar boost in the voice category might lead to an even higher rank.