
TESTING METHODOLOGY
The methodology of the P3 connect Mobile Benchmark is the result of P3’s many years of experience. It was carefully designed to evaluate and objectively compare the performance and service quality of the UK’s mobile networks from the users’ perspective.
The P3 connect Mobile Benchmark took place throughout September 2016. All samples were collected du- ring the day, between 8am and 10pm. The network tests covered inner-city areas, outer metropolitan and suburban areas. Measurements were also taken in smaller towns and on trunk roads and motorways. The combination of test areas had been selected to provide a significant series of test results covering the UK population in England, Scotland, Wales and Northern Ireland. The areas chosen for the 2016 test account for more than 14 million people, or approximately 23% of the total population of the UK.
P3 conducted the tests with four drive-test cars, equipped with arrays of Samsung Galaxy S5 Cat 4 smart- phones (Voice) and Samsung Galaxy S7 Cat 9 smartphones (Data) for the simultaneous measurement of voice and data services. Additionally, two teams conducted the walk tests, measuring voice and data performance.
Voice testing
For the voice walk tests, one wal- king operator contacted a counterpart located in one of the drive test cars. Furthermore, two smartphones per operator in each car were used for voice tests from car to car. The voice quality was evaluated based on the HD-voice capable and ITU standardised so-called POLQA wideband algorithm. In order to account for typical smartphone use scenarios during the voice tests, background data traffic was generated in a con- trolled way through random injection of small amounts of HTTP traffic. The voice test scores account for 40% of the total benchmark results.
Data testing
Data performance was measured using one smartphone per operator in each car. The radio access technology was set to LTE preferred mode in order to reflect the customer experience. All the tests were conducted with the best-performing mobile plan available from each operator and in a full drive and walk test mode covering big cities, small towns and major connecting roads, including motorways. The data scores account for 60% of the total results.
Routes and Samples
The test routes are shown on page 1 of this report. In the big cities and smaller towns indicated, the cars had to follow predefined routes. Altogether more than 80,000 speech samples were logged per operator, about half of them in 4G-preferred-to-4G-preferred mode, while the other half were 4G-preferred-to-3G-preferred. For the data benchmark about 50,000 samples were obtained per operator. About 60 % of the samples were obtained in big cities while the remaining 40% were collected in towns and on connecting routes.
Performance indicators and rating
To reflect the critical importance of service access and stability, the percentage of these two KPIs was the most heavily weighted. We also measured performance indicators for voice such as call setup time and speech quality. For data, performance indicators included the average session time to access web pages or transmit small files, throughput rates and average start times and resolution for YouTube videos.
The score weighting reflects both the geographical distribution of the UK‘s population and a ranking of usage scenarios. Therefore, 675 of the total of 1,000 maximum points were assigned to the cities – 525 maximum points referring to the drive test results (data: max. 315 points, voice: max. 210 points in voice) and 150 maximum points reflect walk test results (data: max. 90 points, voice: max. 60 points). In towns and on connecting roads, only drive tests were carried out. In the towns, a maximum of 150 points is available, with a maximum of 90 points in the data, and 60 points in the voice category. To reflect the importance of connectivity while driving on the road network, a total of 175 points has been allocated to this category, divided into a maximum of 105 points for the data results and 70 points for the voice results. The table on page 2 shows the percentage of maximum points that each operator reached in each discipline.

Three boxes were mounted into the back and side windows of each measuring car in order to support twelve smartphones per car.
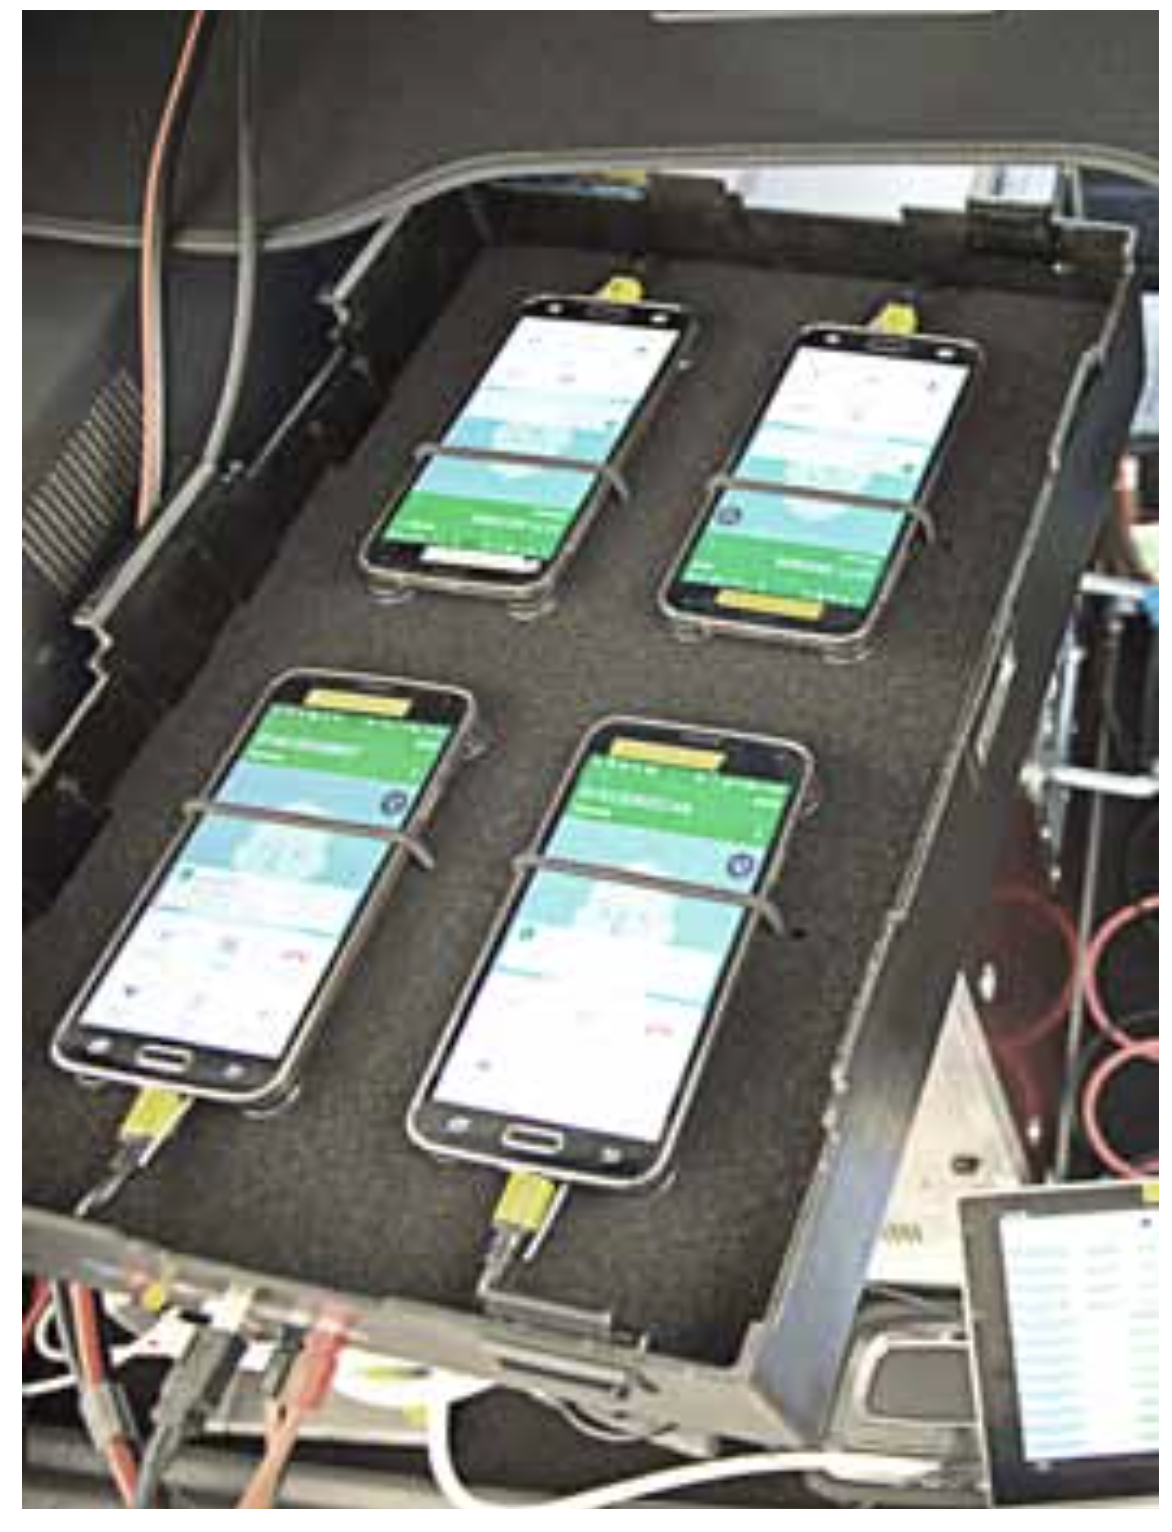
Each box was housing four smartphones which allowed the simultaneous testing of four mobile operators.

Hakan Ekmen, CEO, P3 communications GmbH and Bernd Theiss, Head of connect’s test lab, inspect the testing equipment.


ConclusioN
Even with our fine-grained scheme awarding a maximum of 1,000 points, in 2016 we have two equally strong operators at the top.
The race was extremely close, and even our fine-grained scoring scheme ended up with a photo-finish dead heat between two winners: Scoring exactly 803 points out of the possible maximum of 1,000 points, EE and Vodafone share the winning position this year. EE achieves joint top-spot on the back of its very strong data performance, while Vodafone scores best in the voice category. O2 is nonetheless very close when considering voice-only but is held back from achieving a better total by its limited data performance. Interestingly, last year‘s distinct winner EE achieves the weakest score in the voice category. This however does not mean that EE is particularly bad in this discipline – but that its competitors successfully made inroads on their opponent in this field. Three ranks third with good overall results.
Scrutinising benchmarks certainly helped to improve the Uk‘s mobile networks
Probably the most interesting and positive outcome of 2016‘s P3 connect Mobile Benchmark UK is that three out of four operators were rated “good“ despite the use of a more demanding scoring scheme than last year. This is an unprecedented result in this market. A glance at the development of the scores achieved in the last three years shows the great improvements that the UK operators implemented in this period. P3 and connect take pride in the assumption that our scrutinising benchmark has very probably played an important role in this process.

The total score development over the last three years shows the great improvements of the uK networks.


With excellent data performance, EE is clearly ahead of the competition in this category. So last year’s winner is still one of now two top operators in the UK. If EE had not lost some ground in the voice discipline, it might still be the uncontested number one. Regardless, EE customers enjoy one of the UK’s best mobile networks.


Compared to 2015, Vodafone hit the biggest score improvement – which reflects the advances of its mobile network. Vodafone ranks best in the voice discipline and stays narrowly ahead of EE’s overall results in the cities and towns. In spite of some room for improvement on roads, Vodafone is one of the UK’s best operators.


Two test category top-spots helped put Three in third position overall this year – which is also their re- spective rank in the voice and data categories. In the voice discipline, Three scores best on connecting roads and also achieves good results in smaller towns. Adding its nice data performance, Three deserves the overall grade „good“.

In comparison to 2015’s bench- mark, O2 also achieves a considerable improvement in its score and KPIs. Scoring best in the voice tests conducted in London and ranking second in the voice discipline overall, the operator might consider putting additional efforts into strengthening and enlarging its data service.
Outlook
Objective testing will be essential to the approaching 5G networks as well as emerging technologies like autonomous driving and smart cities. P3 communications is preparing for these future challenges.
Implementing super-fast 5G connectivity in the UK will require accurate and objective data about coverage and the user experience. However, with 5G‘s approach of assigning different network capabilities to different use cases, an extended approach to network testing will also be required. P3 communications is already planning for this not-too- distant future by developing concepts to benchmark and analyse future networks‘ end-to-end performance with advanced analytics and big-data technology.
Extensions to the test routines
But the future is not a couple of years away – it actually starts tomorrow. Therefore, in order to augment its testing methodology, P3 communications has developed a comprehensive network- quality metric-collection method that also involves crowdsourcing. Starting as soon as the 2017 network benchmark season, crowd- sourcing can be expected to be- come part of P3‘s scoring scheme.
Readers interested in taking part in this approach can already participate by downloading the “U get“ wireless performance rating app – see details on the right-hand side. In addition, Voice over LTE (VoLTE) will be an integral part of next year‘s testing programme in the UK, as 2017 will see a proliferation of devices supporting this with some operators already having launched VoLTE services this year.
Also, with Cat 9 becoming relevant for a larger user base and even the first Cat 12 devices appearing on the market, P3 will prepare for increasing data speeds as well as considering new environments and over-the-top services.

P3 communications is constantly monitoring technological development – for example by regularly participating in industry events.

crowdsourced network rating
P3 communications is increasingly focussing on aspects like the retainability of voice services, the integrity of data services and “operational excellence“. An important instrument for this approach is the “U get“ app that is available under uget-app.com or via the adjoining QR code. This app checks and visualises current network performance. Join the global community of users who understand their personal wireless performance, while contributing to the world’s most comprehensive picture of the mobile customer experience.
Autonomous Driving

The future of transport is quickly coming upon us – one half-mile loop at a time. Filling the UK‘s garages and motorways with automated vehicles would mark a giant leap towards efficiency, convenience and luxury. However, to ensure that driverless cars can maintain connectivity and thus optimal performance and safety, we need to ensure that the technological infrastructure can manage the increasing demand that machines will place upon it. Therefore, autonomous driving scenarios play an important role in P3 communications‘ concepts for the evolution of mobile network testing.
Smart Cities

Today, 54% of the world’s population lives in urban areas, a pro- portion that is expected to increase to 66% by 2050. Mobile communications will be an essential component to delivering on smart city promises. To enable smart cities to thrive and host successful businesses in the digital era, their technological infrastructure must be capable of managing the increased demand on network usage. Therefore it will be a future focal point of P3 communications to determine whether cities become truly smart by taking an even closer look at their advances in connectivity.