METHODOLOGY
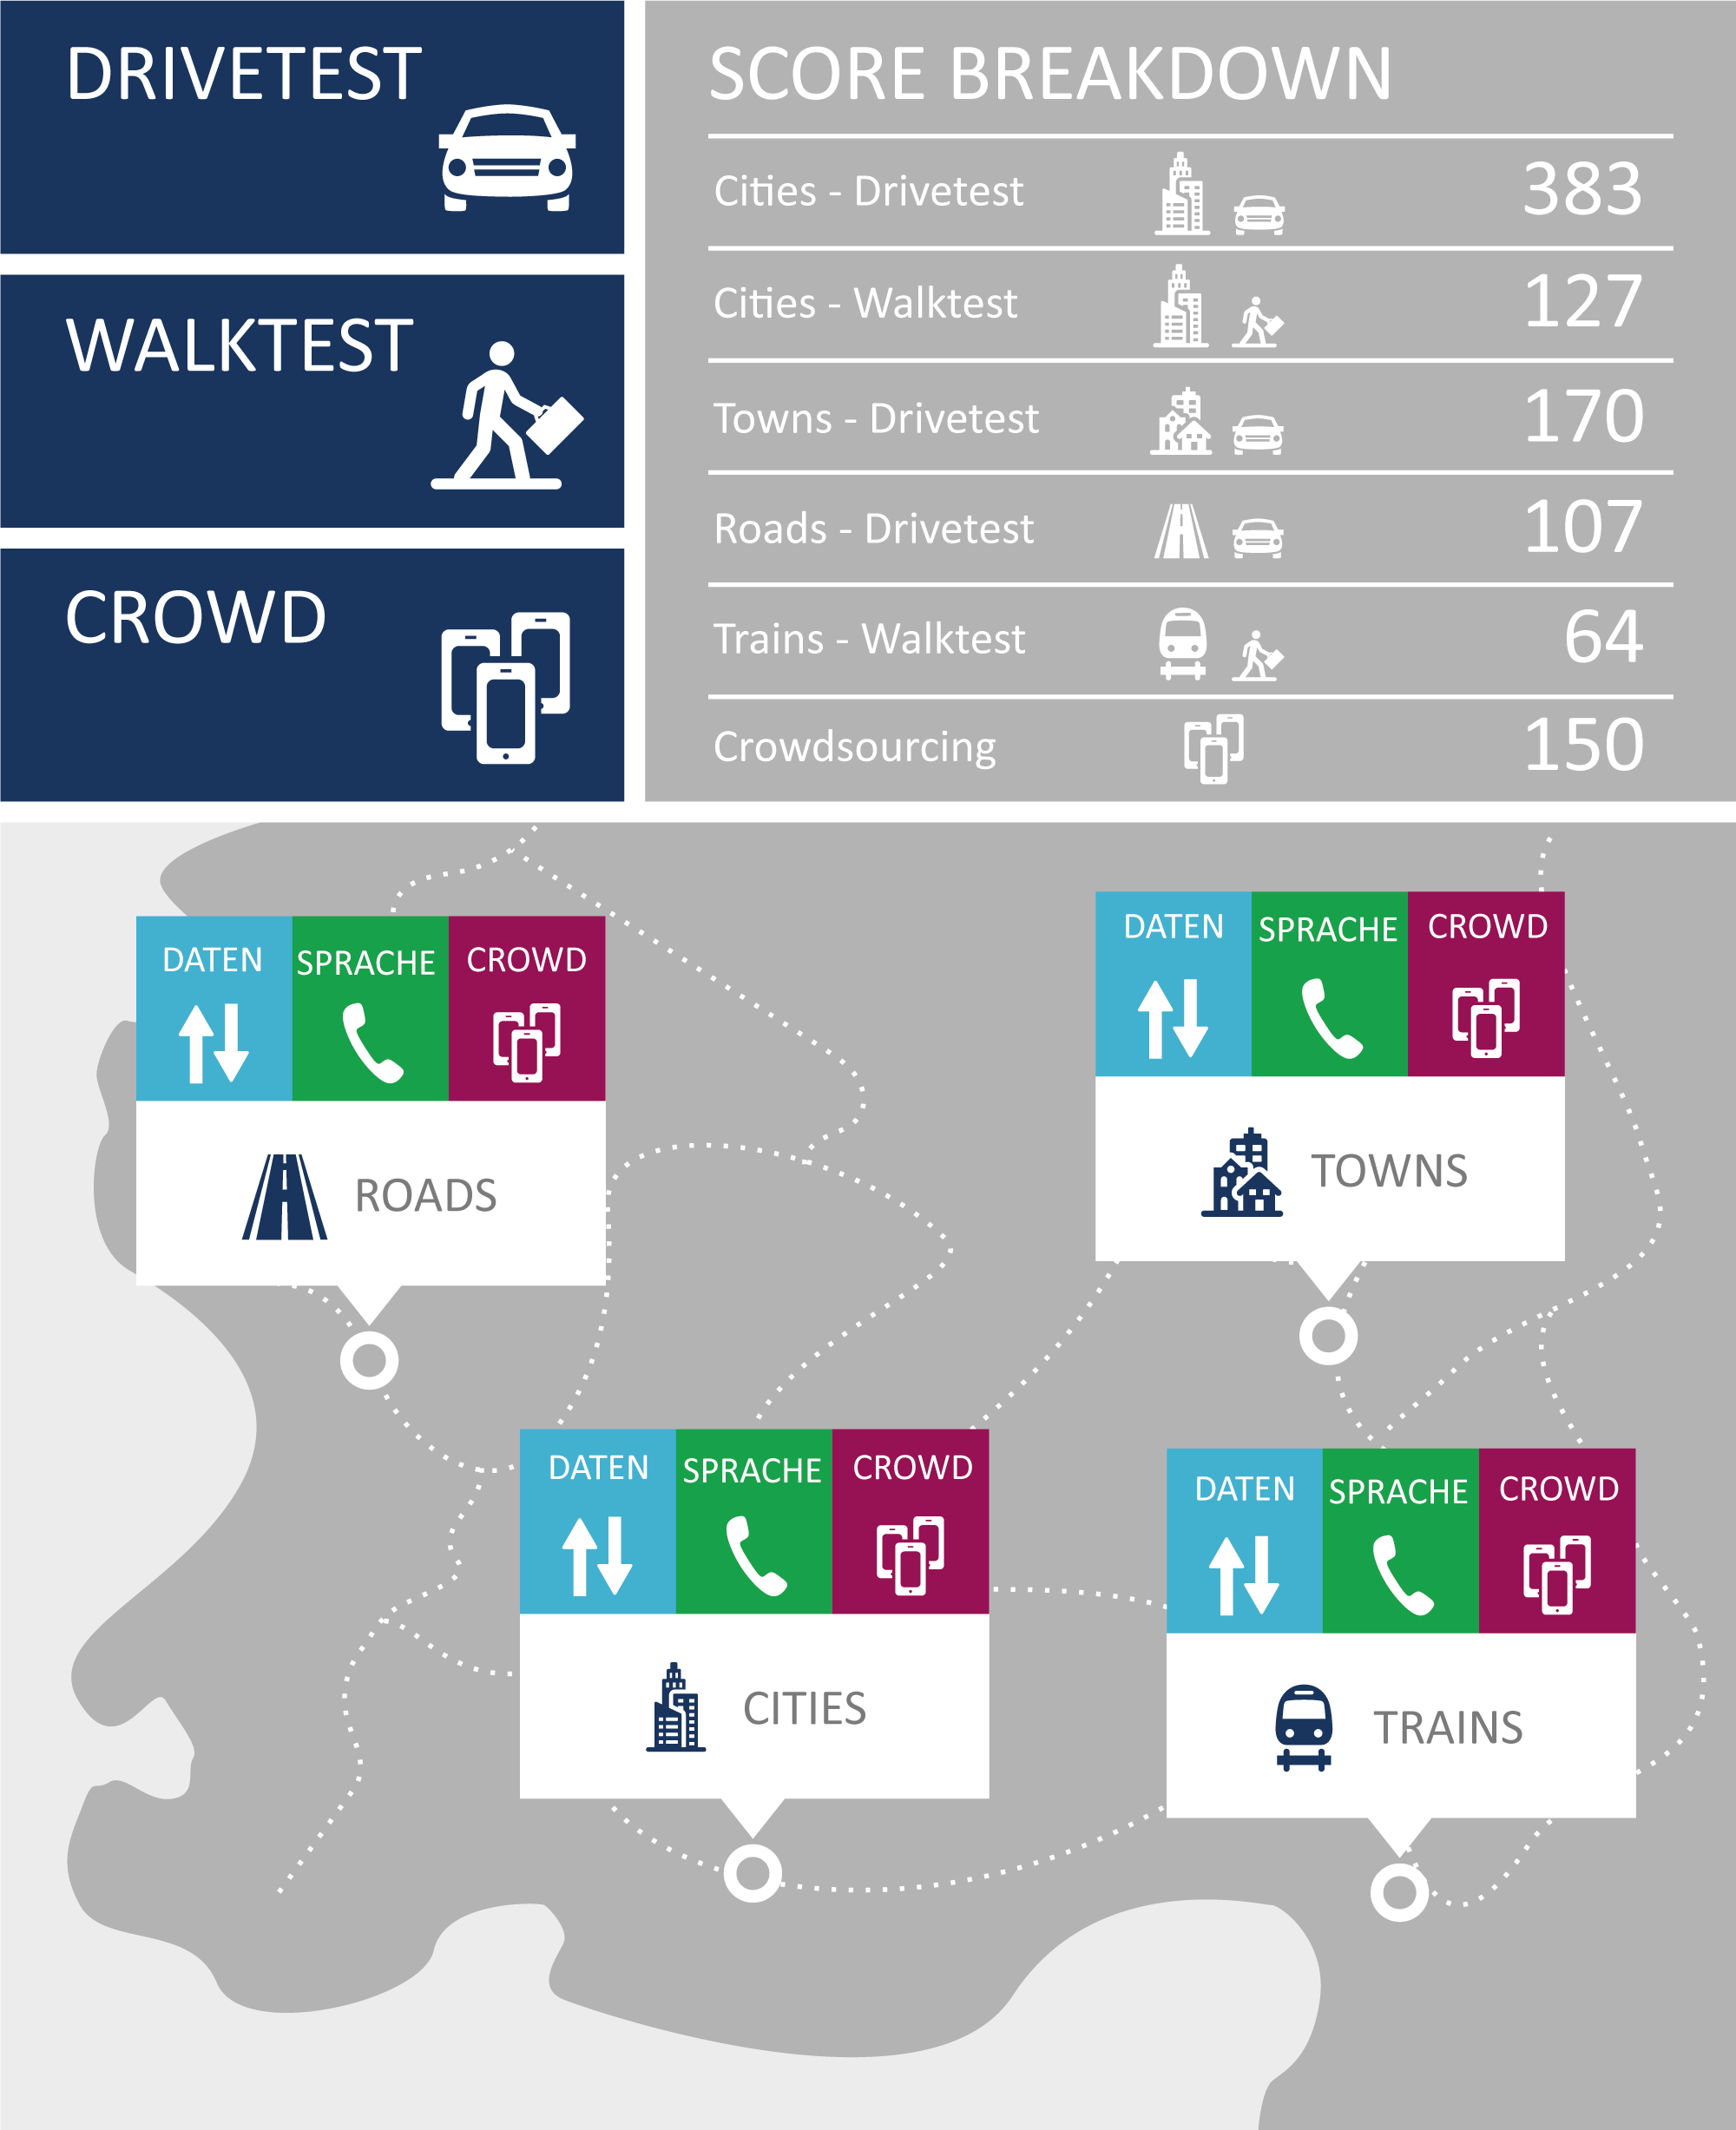
The tests in Germany took place from October 13 to November 12, 2018 – the ones in Austria from October 20 to November 9. For each country, connect‘s partner for the network measurements, P3, used two vehicles for drivetesting the chosen cities, towns and roads. Each car carried a total of six Samsung Galaxy S8 smartphones. One per operator was used for the voice tests and another one for the data measurements.
In addition to the drivetest, in each country a walktest team took measurements by foot. For this effort, the teams visited so-called “areas of interest“ with a strong visitor frequency like train stations, airport terminals, coffee shops, museums and also local public transport. Travelling from city to city allowed the assessment of cellular network quality within long distance trains.
The walktest teams also utilised Samsung Galaxy S8 smartphones that were installed in trolleys and back packs with additional strong batteries.
The devices’ firmware was each operator’s current firmware version. If such software was not available, the most current firmware from the smartphone manufacturer was used.
Voice telephony
Voice services were measured with the smartphones performing calls alternating between the measurement cars (“mobile to mobile“). The walktest teams called a stationary counterpart for all voice tests.
Background data traffic was transmitted by one of the smartphones simultaneously to each call in order to reflect a realistic usage scenario. Audio quality was assessed by using the HD-Voice capable POLQA (Perceptual Objective Listening Quality Assessment) wide band scoring.
All devices were configured in “LTE preferred” mode. Thus, they could benefit from the more modern “Voice over LTE“ (VoLTE) whereever this was available.
Data connectivity
To assess cellular data performance, a sequence of tests was executed. As a dynamic web browsing test, each country’s top websites (according to the Alexa ranking) were downloaded in the so-called live webbrowsing test. Additionally a static website was tested, the industry standard ETSI (European Telecommunications Standards Institute) Kepler reference page.
HTTP downloads and uploads were conducted with 3 MB and 1 MB files, simulating small file transfers. The networks’ peak performance was tested with a seven second download and upload of a single, very large file.
The Youtube measurements performed on the smartphones considered the “adaptive resolution“ feature of this video platform. In order to offer a persistent video experience, Youtube adapts the video streams‘ resolution dynamically to the bandwidth that is currently available. Our scoring therefore considers the success ratio, the time until the playback starts, the percentage of video playouts that take place without interruptions as well as the videos‘ average resolution or line number count respectively.
Logistics
All drivetests and walktests were done between 8 am and 10 pm. During the drivetests, two cars were present in the same cities, but on different routes to avoid any interference of one car’s measurement by the other car’s.
On the connecting roads, both vehicles drove a given route, but followed each other at a small temporal and spatial distance. At each location, the test smartphones had to share the networks‘ bandwidth with normal customers. This represents the usual competition for the limited resource of the networks‘ available radio frequencies.
In Germany, the measurements included 19 larger cities and 68 smaller towns, while the walktests frequented ten cities. The measurement cars drove a total of approx. 9,750 kilometers. With their drivetests, they covered about 14.1 million inhabitants which equals about 17.15 per cent of the German population. All in all, a total of 17,570 voice samples und 169,785 data samples was collected.
In Austria, the drivetests covered 11 big cities and 20 smaller towns, the walktest team visited seven cities. Here, the vehicles covered about 3.1 million inhabitants or 35.3 per cent of the population. In the course of the measurements, a total of 12,177 voice and 113,840 data samples was collected.
The definition of the test routes follows a well-defined process: P3 generates four independent and representative city and route plans. The connect editors then randomly choose one of these four alternatives.
Crowdsourcing
The results of the crowdsourcing analyses performed by P3 contribute 15 per cent of the total score. For this purpose, a total of 1.48 billion single measurement values from von 227,000 mobile communications users from August until October 2018 was evaluated. For Austria, approx. 710 million values from 76,000 users. For Germany, this comprises 88.5 per cent of the total built-up area, in Austria 89.7 per cent.
The data base for these analyses is obtained by more than 800 popular apps. They log in the background whether there is a network connections, which mobile network technologies are available and what download data rates can be achieved – provided that the user has before agreed to this completely anonymous data collection.
These measurement values are gathered every 15 minutes and transmitted once a day to P3‘s servers. The reports only comprise of a small number of bytes so that they do not put a substantial strain to the users‘ data volumes. Readers who wish
to actively support our network test can do this by installing and using the connect app (see box below). However, it is only one of many apps containing the described background functionality.
Network coverage
In order to determine the coverage with 4G, “data“ (3G and 4G) as well as telephony, P3 applies a grid of 2 by 2 km tiles to the test area. These “evaluation areas“ are then sub-divided into 16 smaller tiles. In order to ensure the stastistical relevance of the results, P3 demands a minimum number of users and measurement data per tile. These depend on the number of operators in a country and the total number of their customers. If one contender does not meet these requirements in a certain tile, this tile will not be considered for any of the operators for the sake of fairness.
Even if the smartphone displays the availability of voice and data services in an evaluation area, this does not automatically mean that these services can actually be used. Therefore, P3 additionally determines the “quality of coverage“. It indicated, how often users could have actually used the required network service.
Data speed
P3 also investigates the highest download speed that was reached by each participating users per evaluation area during the examined period. For these values, the average is calculated. Additionally, we specify the “P90 values“ – the threshold within a statistical distribution under which 90 per cent of the measurement values range. This indicates the network performance over all evaluation areas and also all users under favourable conditions.
Service availabilty
Another aspect determined in the crowdsourcing are outages of degradations of the (data) network connectivity. A sophisticated algorithm distinguishes simple loss of network coverage (such as in elevators, car parks or indoors) from actual degradations. Incidents that occur at night between 0 am and 6 am are not considered. In contrast to the other crowd results, the service availability considers a six month period – here. from May to October 2018.
Points will be deducted for the number of days and the number of hours with service degradations.
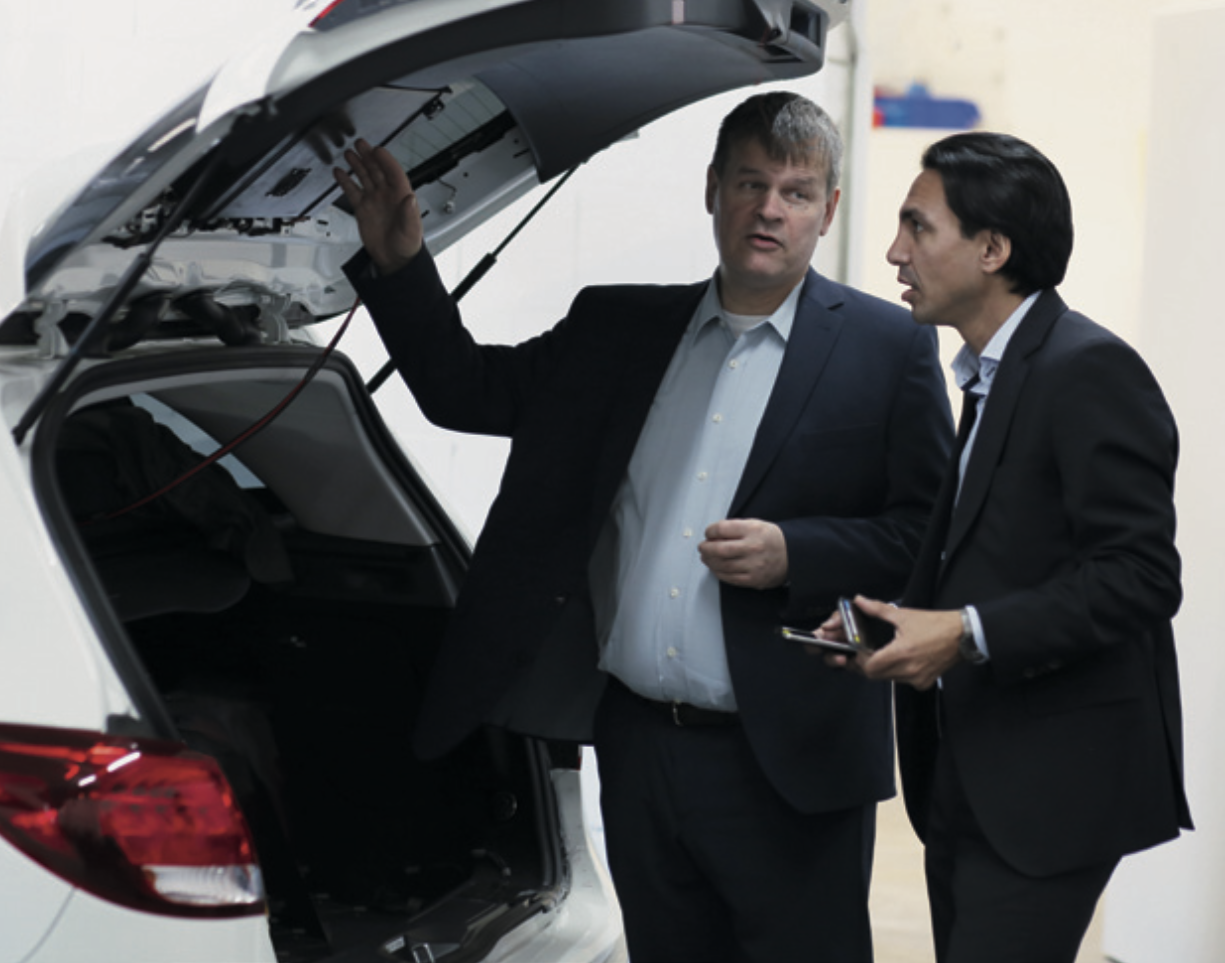
Professional and critical: Bernd Theiss, head of test and technology at connect (on the left), and Hakan Ekmen, managing director of P3 communications (on the right).
Boxes mounted to the rear and side windows of the cars contain the smartphones used for testing.
Each drivetest vehicle carried six Samsung Galaxy S8 smartphones.
Participate in our crowdsourcing
The connect app not only allows you to take part in our crowdsourcing. Above that, you receive latest telecommunications news and you can also check the speed of your network with an informative speed test. The Android version additionally reveals interesting details like data consumption and usage time per app.
Only if you agree, the app will also perform completely anonymous connection tests in the background. The required data is less than 2 MB per month.
You will find the Android version on the Google Play Store here.
And the iOS version is available on the Apple App Store here.
Fairness and transparency
connect and P3 ensure maximum fairness and transparency.
Part of our standard to ensure fully fair and transparent testing is to inform the operators early about the basic parameters. This so-called framework consists of the smartphones used for testing, the considered KPIs, the basic scoring scheme as well as of the exact timing. connect and P3 defined these frame conditions early in 2018 and subsequently informed the CTOs of the operators about them.
We are open for feedback and suggestions, critically checking every single one. If we regard them as being justified, we then adapt the procedures for all candidates. However, once again we had to decline some suggestions, as we concluded that some operators just wanted to enforce measurement methods which would be advantageous to their own networks only. However, the often intense discussions prove that all involved operators take our methodology as well as our results very seriously.
Still, the high relevance of connect‘s mobile network test to the operators sometimes takes on strange forms. connect readers called our attention to the fact that during the testing one of the operators installed mobile base stations close to a part of the autobahn that was likely to be part of our drivetest route. As investigations by connect concluded, this may be a common procedure before the planned buildup of new network cells at the location in question. Additionally, intense examinations conducted by P3 also showed that even an installation of all available mobile base stations would not noticeably affect the result of an operator.
In one country which was not participating in the network test at hand, we also noticed an attempt to polish the crowdsourcing results up by the means of manipulated smartphones. They conspiciously travelled throughout the whole country. However, as the conspicious results were easily recognisable, P3 managed to filter them from the data pool. It is unclear whether an operator, a supplier or a competitor of connect is behind these manipulations and whether they intended to boost the results of the affected network or to discredit the same network or connect – especially as it is not possible to identify the originator due to the anonymous data collection.
Hannes Rügheimer, connect author
conclusion
Our network test has been the de-facto industry standard for many years, thanks to its elaborate methodology and continuous adaptation to technological innovations.
As announced last year, we have made it even more comprehensive by now amending the new dimension of crowdsourcing.
In Germany, a strong Telekom achieved the overall victory for the eighth time in a row. The Bonners were even able to top their previous performance once again. In our new crowd discipline, Telekom also takes the lead. Vodafone’s overall performance remains more or less constant – resulting in the second rank and the grade good for the Düsseldorf based operator. The crowd score achieved by Vodafone ranks in the middle field as well.
Although O2 remains on the third rank at some distance to the other contenders, the Munich company managed to increase their performance clearly compared to the previous year. Especially in larger cities, the efforts taken for the integration and expansion of the formerly separate E-Plus and O2 networks pay off. However, in smaller towns and on the connecting roads, there remains work to be done.
The results of our tests on German railways are nothing but sad. No progress at all can be seen in comparison to previous years. Poor performance results both for telephony and data communications clearly demand for finally facilitating some improvements in this field to all three German mobile operators.
In Austria, the performance level of the mobile network is altogehter higher than in Germany. All three Austrian operators achieve the grade “very good“.
This time, T-Mobile manages to battle its way to the top from the third rank in the previous year. This operator owes its success to distinct improvements particularly in the data discipline.
Market leader A1 Telekom ranks second at a close call. In the new crowd score, A1 even leads the field. This operator is especially stong in smaller cities, where it takes the lead at a narrow distance over T-Mobile and a more distinct one over Three.
Hutchison/Three’s result is about the same as last year. A direct comparison reveals a slight improvement in the voice and a slight degradation in the data discipline. Furthermore, the crowd score indicates some weaknesses in 4G coverage. But all in all, Three also achieves the overall grade “very good“.
On the Austrian railways, T-Mobile was able to improve its voice results in comparison to last year. The other contenders drop back a little compared to their previous results. In the data discipline, all three have lost some points. Presumably the considerably improved WiFi offering of the Austrian Railways ÖBB puts more stress on the mobile networks. However, in comparison to Germany, the results still demonstrate a clear lead.


