

TESTING METHODOLOGY
The methodology of the umlaut connect Mobile Benchmark is the result of more than 15 years of testing mobile networks. Today, network tests are conducted in more than 80 countries. Our methodology was carefully designed to evaluate and objectively compare the performance and service quality of mobile networks from the users’ perspective.
The umlaut connect Mobile Benchmark Spain comprises of the results of extensive voice and data drivetests and walktests as well as a sophisticated crowdsourcing approach.
DRIVETESTS AND WALKTESTS
The drivetests and walktests in Spain took place between late September and mid-October 2019. All samples were collected during the day, between 8.00 a.m. and 10.00 p.m. The network tests covered inner-city areas, outer metropolitan and sub-urban areas. Measurements were also taken in smaller towns and cities along connecting highways. The connecting routes between the cities alone covered about 1,900 kilometres per car – 7,630 kilometres for all four cars. In total, the four vehicles together have covered about 11,570 kilometres.
The combination of test areas has been selected to provide representative test results across the Spanish population. The areas selected for the 2019 test account for 11.7 million people, or roughly 25.2 per cent of the total population of Spain. The test routes and all visited cities and towns are shown here.
The four drive-test cars were equipped with arrays of Samsung Galaxy S9 smartphones for the simultaneous measurement of voice and data services.
VOICE TESTING
One smartphone per operator in each car was used for the voice tests, setting up test calls from one car to another. The walktest team also carried one smartphone per operator for the voice tests. In this case, the smartphones called a stationary counterpart. The audio quality of the transmitted speech samples was evaluated using the HD-voice capable and ITU standardised so-called POLQA wideband algorithm.
All smartphones used for the voice tests were set to VoLTE preferred mode. In networks or areas where this modern 4G-based voice technology was not available, they would perform a fallback to 3G or 2G.
In the assessment of call setup times we also rate the so-called P90 value. Such values specify the threshold in a statistical distribution, below which 90 per cent of the gathered values are ranging. For speech quality, we publish the P10 value (10 percent of the values are lower than the specified threshold), because in this case higher values are better.
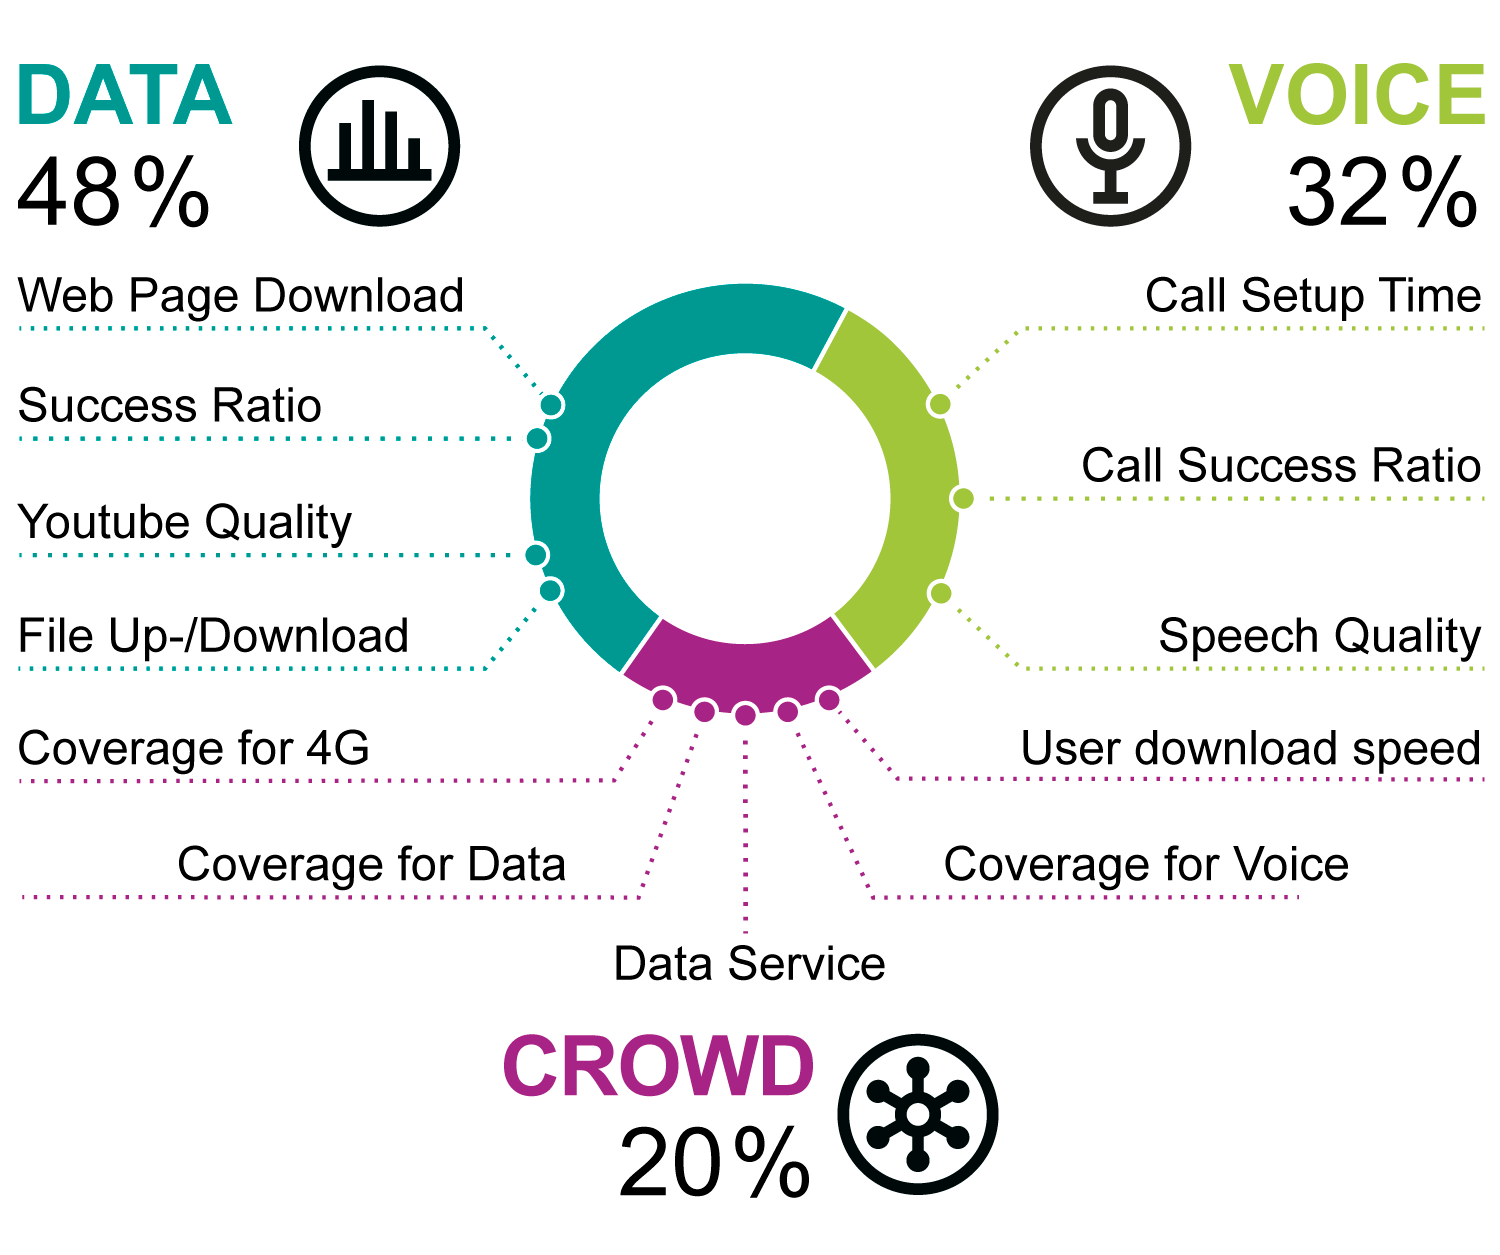
In order to account for typical smartphone-use scenarios during the voice tests, background data traffic was generated in a controlled way through injection of 100 KB of data traffic (HTTP downloads). As a new KPI in 2019, we also evaluate the so-called Multirab (Multi Radio Access Bearer) Connectivity. This value denominates whether data connectivity is available during the phone calls. The voice scores account for 32 per cent of the total results.
DATA TESTING
Data performance was measured by using four more Galaxy S9 in each car – one per operator. Their radio access technology was also set to LTE preferred mode.
For the web tests, they accessed web pages according to the widely recognised Alexa ranking. In addition, the static “Kepler” test web page as specified by ETSI (European Telecommunications Standards Institute) was used. In order to test the data service performance, files of 5 MB and 2.5 MB for download and upload
were transferred from or to a test server located in the cloud. In addition, the peak data performance was tested in uplink and downlink directions by assessing the amount of data that was transferred within a seven seconds time period.
The evaluation of YouTube playback takes into account that YouTube dynamically adapts the video resolution to the available bandwidth. So, in addition to success ratios and start times, the measurements also determined average video resolution.
All the tests were conducted with the best-performing mobile plan available from each operator. Data scores account for 48 per cent of the total results.
CROWDSOURCING
Additionally, umlaut conducted crowd-based analyses of the Spanish networks which contribute 20 per cent to the end result. They are based on data gathered
between mid-April and end of September 2019.
For the collection of crowd data, umlaut has integrated a background diagnosis processes into 800+ diverse Android apps. If one of these applications is installed on the end-user’s phone and the user authorizes the background analysis, data collection takes place 24/7, 365 days a year. Reports are generated for every hour and sent daily to umlaut‘s cloud servers. Such reports occupy just a small number of bytes per message and do not include any personal user data. Interested parties can deliberately take part in the data gathering with the specific ”U get“ app (see below).
This unique crowdsourcing technology allows umlaut to collect data about real-world experience wherever and whenever customers use their smartphones.
NETWORK COVERAGE
For the assessment of network coverage, umlaut lays a grid of 2 by 2 kilometres over the whole test area. The “evaluation areas“ generated this way are then subdivided into 16 smaller tiles. To ensure statistical relevance, umlaut requires a certain number of users and measurement values per operator for each tile and each evaluation area.
In our 2019 benchmark framework, we differentiate between a „Benchmark View“ and an „Own Network View“ at the crowd results: For the Benchmark View, only those evaluation areas are considered for which we have determined valid results for all operators who are considered in the benchmark. In the „Own Network View“ this exclusion is not made – an evaluation area will be considered if there are valid samples for the assessed operator, regardless of the presence of competitors.
Above that, we now distinguish urban and non-urban areas in our crowd evaluations – respecting that the coverage with mobile services is usually higher in urban areas than in rural surroundings. We specify according coverage values for the coverage of voice services (2G, 3G and 4G combined), data (3G and 4G combined) and 4G only.
DATA THROUGHPUTS
Additionally, umlaut investigates the data rates that were actually available to each user. For this purpose, we determine maximum download and upload data rates
per user within 15 minute slices. These values are then aggregated per evaluation area in 4-week-timeslices, for each of which we determine the P90 value. For the final calculation of this KPI we then calculate the average of the results of the six timeslices.
DATA SERVICE AVAILABILITY
Also called “operational excellence“, this parameter indicates the number of “service degradations“ – events where data connectivity is impacted by a number of identified anomalies with sufficient severity. To judge this, the algorithm compares similar timeframes on similar days in a window around the day and time of interest. The algorithm looks at large scale anomalies on a network-wide level and ensures that individual users‘ degradations such as a simple loss of coverage due to an indoor stay or similar reasons can not affect the result.
In order to ensure statistical relevance, valid assessment weeks and hours must fulfill distinct requirements. Each operator must have sufficient statistics for trend and noise analyses per each evaluated time windows. The exact number depends on the market size and number of operators. Data Service Availability is based on the same 24-week observation period as our other crowd results.

Two boxes were mounted into the rear and side windows of each measurement car in order to support eight smartphones per car.

One Samsung Galaxy S9 per operator took the voice measurements and one additional S9 per operator was used for the data tests. All test phones were operated and supervised by umlaut‘s unique control system.

PARTICIPATE IN OUR CROWDSOURCING
Everybody interested in being a part of our global crowdsourcing panel and obtaining insights into the reliability of the mobile network that her or his smartphone is logged into, can most easily participate by installing and using the “U get“ app. This app exclusively concentrates on network analyses and is available under http://uget-app.com.
“U get“ checks and visualises the current mobile network performance and contributes the results to our crowdsourcing platform. Join the global community of users who understand their personal wireless performance, while contributing to the world’s most comprehensive picture of mobile customer experience.
ConclusioN
Vodafone wins for the fifth time in a row. Orange manages to defend its second rank and shows the most distinct score improvements over last year‘s results. Movistar ranks third and Yoigo fourth, both with overall “good“ results.
The clear winner of the umlaut connect Mobile Benchmark Spain is Vodafone – for the fifth time in a row. Orange succeeds in defending the second rank, which it took last year from its constant rival Movistar. Achieving a substantial improvement over it‘s 2018 score, Orange solidifies its position. Like the winner, Orange also achieves the overall grade „very good“.
Movistar ranks third overall but still holds the second position in the data discipline. As in the previous year, the Telefónica brand achieves the grade „good“. The same is applicable for the smallest Spanish operator, Yoigo. In the overall assessment, Yoigo loses some points but also manages to improve in some areas such as the reliability of data connections on rural roads.
In our crowdsourced assessment which is designed to augment and verify the drivetest and walktest results, Movistar takes the lead from Orange. In the Data Service Availability category, we could not identify any degradations in any Spanish network in the whole 24-week evaluation period. And our first trial measurements for 5G in the Vodafone network emphasize the distinct advantages of this future mobile communications standard.


For the fifth time in a row, Vodafone is the winner of our Mobile Benchmark in Spain. The operator clearly leads both in the voice and data categories. Also, providing us with an outlook at the capabilities of 5G connectivity, Vodafone proves that it is well positioned for the future.


Orange keeps the second rank which it took from its constant rival Movistar in the previous year. Showing an overall “very good“ performance, the operator ranks second in the voice and crowdsourcing disciplines and third by a close margin in the data assessment. It managed to distinctly improve its score over the previous year.

With strong data results and an overall good voice score, the largest Spanish operator ranks third. It achieved the best result in our crowdsourcing evaluations. Compared to its 2018 scores, the Telefónica brand has lost some points, but it managed to still achieve the overall grade “good“.

Spain‘s smallest operator scores fourth, but still achieves the overall grade “good“. In comparison to last year‘s results, Yoigo lost some points. But the operator manages to improve in some areas such as the reliability of data connectivity evaluated in our drive-tests on rural roads.